


Map of the Stations
To see the bias corrected climate ensembles/projections of a station you can select the station in the map below.
There you will be able to download all the plots for this station or add the station the the selection form. By filling out the form and clicking on 'add plots' you will be able to see the plots here and compare them. Your selected plots will apear at the bottom of this page.
Plot explanation
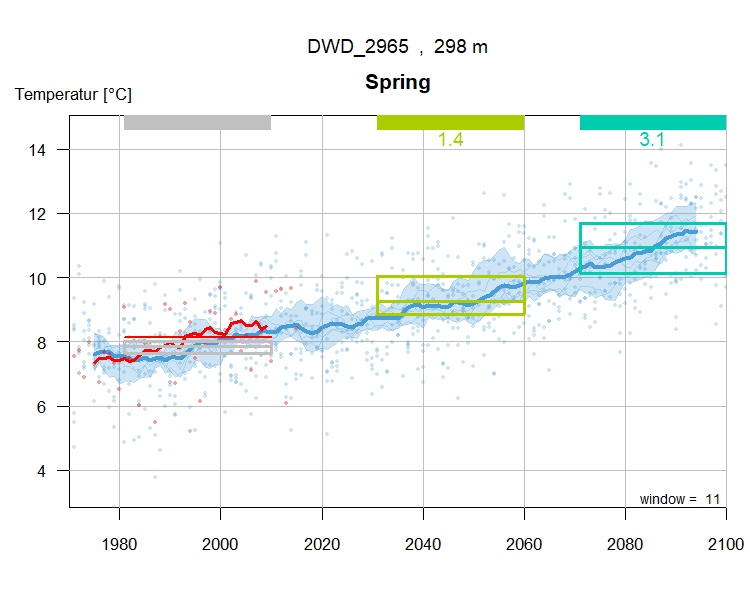
Dots mark the annual data.
Lines mark the 11-year moving means. (The average of a window of 11 years around a point)
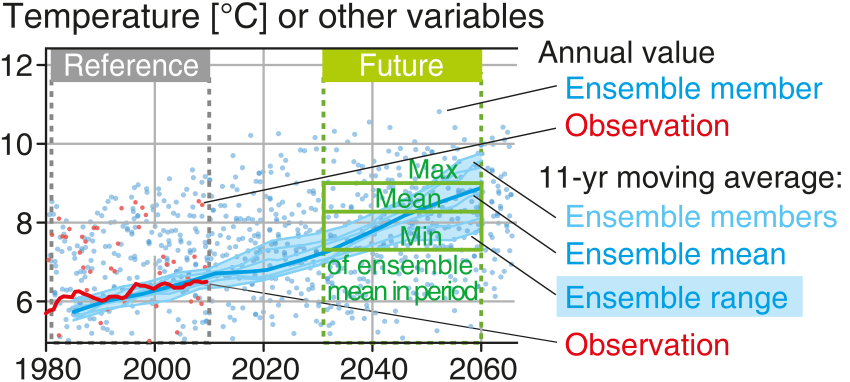
This is the plot explanation from the ASG-II project synthesis.
Plots
© HyFr (2024)